Oct 24, 2025
Vaggelis Kapetanakis
How we build a histogram-powered Retool custom component that helps you visualize your filter data

tl;dr here's the repository
Typical range sliders are great for setting the min-max values for filters, but they fall short when you need to see your data, especially when distributions are uneven or edge cases sneak in.
At stackdrop, we like to push past the standard UI Patterns. That's why we built a Custom Range Slider, an advanced range slider with built-in histogram, flexible value formatting, and smart handling for tricky edge cases.
It's written in TypeScript, designed for Retool and built to expose clean values while giving you visual context that normal sliders can't provide.
Why we built it
Let’s look at a scenario where the custom component really shines.
Imagine you’re adding a filter in Retool for candidates' total years of experience. Most applicants fall between 0 and 20 years, but occasionally you’ll see someone with 45 years - and maybe a handful in the 20 - 45 range.
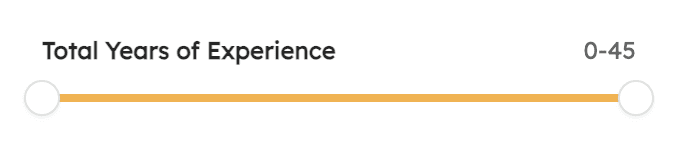
With a standard range slider, that's where things start to break down. Sure, you can set the min and max values, but you lose visibility into where most of your data actually sits. Is the 20 - 45 range active or basically empty? You wouldn't know until you dig through the data manually.
Now, here’s the same filter using the Custom Range Slider
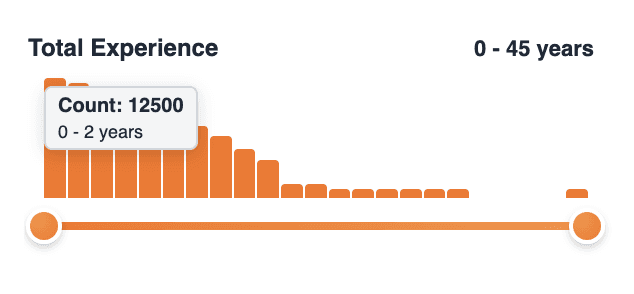
The histogram instantly shows the distribution of candidates, so you can see at a glance that the 20 - 45 range is practically a dead zone. In this case, we also applied a logarithmic scale, ensuring every bar remains visible, even when one has a value of 12,500 and another just 1.
It’s a simple concept, but the impact is huge: clear visual feedback, better filtering, and faster insights - all inside Retool.
Features
The component extends the standard range input with practical enhancements designed for real-world data visualization and filtering.
Histogram Visualization: Display data distribution directly on the slider for immediate insight into value concentration.
Multiple Scale Types: Choose between linear, logarithmic, or square root scales to handle a wide range of data distributions.
Interactive Range Selection: Drag handles to smoothly select min and max values with real-time feedback.
Flexible Data Input: Accepts multiple data formats from Retool queries, making it easy to bind to live datasets.
Custom Formatting: Define custom value formatters using JavaScript functions for complete control over how values appear.
Click-to-Select: Click any histogram bar to instantly select the corresponding range.
Negative Value Support: Optionally display negative values in the histogram for datasets that include both positive and negative values.
Smart Tooltip Placement: Tooltips automatically reposition to remain visible and never get cut off.
Fully Customisable: Adjust colors, labels, and step sizes to fit seamlessly into your design system.
Installation & Usage
Clone the repo
Install dependencies
Login to Retool & initialize the library
You’ll need an API access token with read + write scopes for Custom Component Libraries.
Start development mode
This runs a live-watch mode that syncs your changes directly into your Retool app, ideal for fast iteration.
Deploy your component for production
Deploying pushes an immutable version of your component library into Retool, ready for production use.
Using it in your Retool app
Drag the Custom Range Slider component onto your canvas.
Define the
start,end,defaultStart, anddefaultEndvalues (supports dynamic values)Set the step and label values to match your filter logic.
Optionally define a formatter function, for example:
Configure colors and style to align with your design system
Provide distribution data either as a direct array or dynamically (for example
{{ query2.dataArray }})Optionally switch the histogram scale (defaults to
linear).If your dataset includes negative values, toggle
Show negative valuesso they display correctly
Quick checklist
You’re using a published version of the component, not a dev version, for production use.
Test locally with
npx retool-ccl dev, deploy when ready, then update your app to pin to the latest version.For self-hosted or multi-instance setups, consider using
npx retool-ccl syncto distribute the library across spaces.
Example Usage
Once added to your Retool app, the custom range slider exposes clean and predictable values that can be easily referenced anywhere in your app logic.
You can access the selected range directly from the component’s exposed properties
What's next
We’ve got a few improvements on our radar, these aren’t final, but they hint at where development is headed next.
Auto-generated histograms: Automatically calculate bucket indexes, minimums, and maximums from a simple number[] input.
Customisable histogram appearance: More granular control over bar spacing, styling, and visual balance.
Optional statistics: Display mean, median, and other key metrics directly within the slider for quick insights.
Additional scale types: Add more specialized scales to support diverse data sets and edge cases.
Technical refinements: Reduce technical debt, refactor shared utilities, and improve overall maintainability.
Get involved
We build this component to make internal tools feel as polished as the products they power, and to keep expanding the open toolbox for the Retool community to build on and improve together.
We're always open to ideas, whether it's a feature idea, a bug fix or a completely new use-case. Jump in, share feedback or open a PR ~ we'd love to see what you build and how you make it better.
Give it a try - happy building.